


FCE Green Team 
- 859 Students
- 5 report(s)
- 0 lbs CO2e saved
Step 1: Perform a Baseline Assessment
Or
If you have already started a waste reduction initiative at your school, provide a brief description of the initial problem you observed.
OOS Waste Walk through (lunch area only) and Lunchtime Waste Audit
FCE Green Team
Foster City Elementary
San Mateo-Foster City
Step 2: Create an Action Plan to obtain GSS certification
Or
If you already started a waste reduction initiative, report on what action project(s) you have completed and how you implemented this project at your school.
FCE Organics Waste Diversion Action Plan (lunchtime and recess)
FCE Green Team
Foster City Elementary
San Mateo-Foster City
Step 3: Complete the Action Projects identified in your Action Plan (must do at least one)
Or
If you already started a waste reduction initiative, report on what action project(s) you have completed and how you implemented this project at your school.
FCE Organics Waste Diversion in Action (lunchtime and recess)
FCE Green Team
Foster City Elementary
San Mateo-Foster City
Step 4: Do a Follow-up Assessment and / or report on the actions taken by your class to conserve resources and reduce C02e. Include the numbers here in this step, such as the amount of paper recycled over 30 days.
Post-Lunch Time Waste Audit (Step 4)
FCE Green Team
Foster City Elementary
San Mateo-Foster City
Step 5: Celebrate and Share your project(s)
FCE Virtual Earth Day/Green Team Celebration
FCE Green Team
Foster City Elementary
San Mateo-Foster City
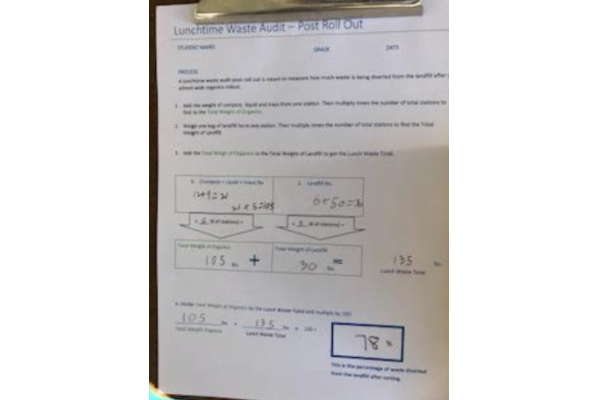
Post-Lunch Time Waste Audit (Step 4)
June 9 2020
Post Organics Diversion Waste Audit is performed to see if metrics are close to first waste audit waste diversion potential.
Summary
A second waste audit was done on January 14th to measure a few things: how student sorting was progressing; measure the current levels of waste diversion and contamination rates; compare current waste diversion rates to the first audit's waste diversion potential rate.
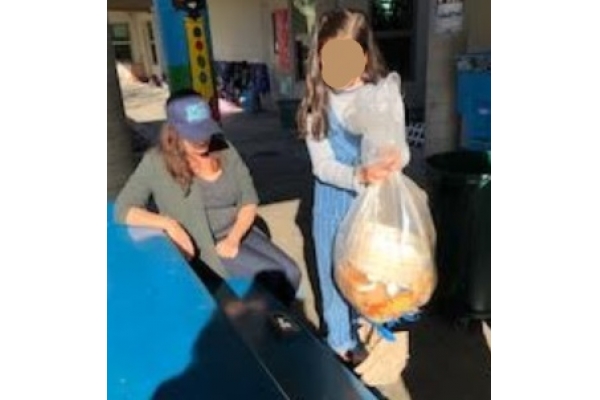
Initial discussion with students reveals that there are challenges and successes to volunteering as bin monitors. Successes are a feeling of accomplishment and helping the planet and animals by minimizing waste to the landfill. Challenges include remembering volunteer days and times and managing peer relationships when it comes to other students not sorting correctly.
The second waste audit reveals that students are potentially creating less total waste by weight because liquids are diverted from the landfill and compost bins (liquids were not taken into account during the first waste audit).
The second waste audit also reveals that student efforts are exceeding the first audits waste diversion potential. Whereas the first audit predicted a 60% waste diversion rate, the second audit results are an actual waste diversion rate of 78%! Coupled with school-wide paper and cardboard recycling, it is estimated that FCE students and staff are diverting between ~90% of waste (by weight) from the landfill on a daily basis!!! Amazing!
Files
Metrics
Organics diverted from the landfill
10650 Pounds of Compostables Diverted from School Waste Stream between November 4th 2019 and March 3rd 2020
Results: 102,849 lbs CO2e emmissions avoided
Photos
 |
|
 |
|